The home fitness industry has experienced significant transformations in recent years, primarily driven by the global COVID-19 pandemic.
As people sought alternatives to traditional gym workouts, home fitness solutions dramatically rose in popularity.
This shift has brought about notable changes in consumer behavior, market trends, and the overall landscape of fitness routines.
These trends indicate a sustained interest in home fitness, driven by its convenience, affordability, and flexibility.
As we move through 2024, understanding these statistics and trends is crucial for anyone involved in the fitness industry, from equipment manufacturers to digital fitness service providers.
This comprehensive overview by PTPioneer will take a look at the key statistics and trends shaping the home fitness landscape in order to provide valuable insights into the future of fitness.
Key Statistics
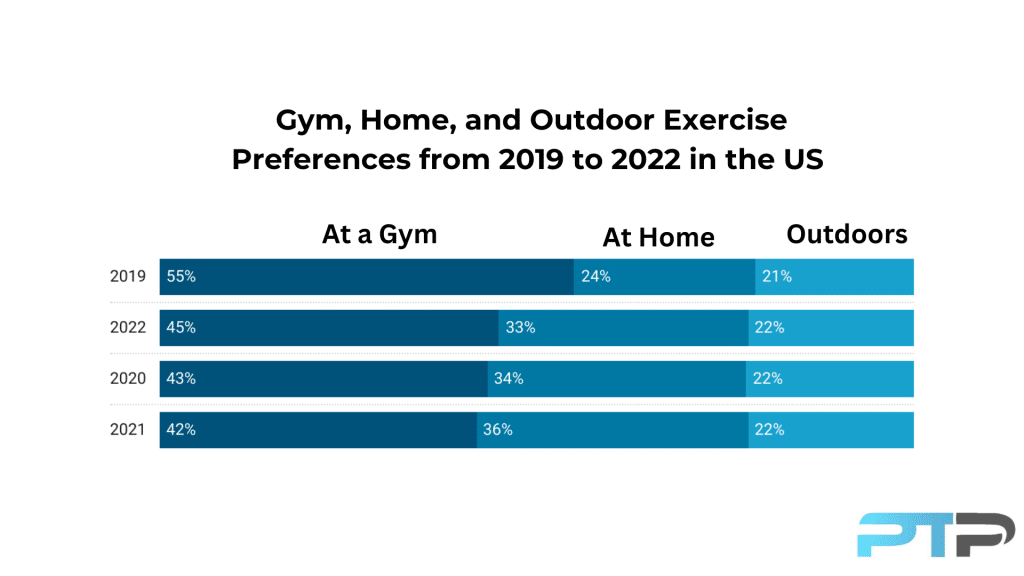
- In 2019, 55% of the US exercisers worked out at a gym, which dropped by 12% in 2020 due to COVID-19 and partially recovered to 45% in 2022.
- The number of people doing home workouts increased from 24% in 2019 to 34% in 2020, peaked at 36% in 2021, and slightly declined to 33% in 2022.
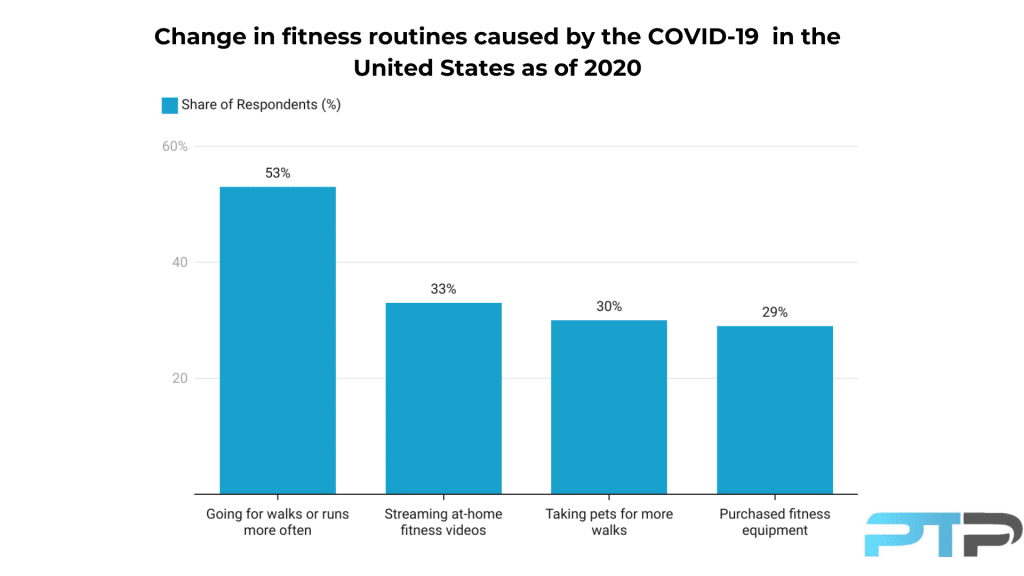
- 33% of exercisers in the US have turned to streaming at-home fitness videos post-COVID, highlighting a significant shift towards digital fitness solutions as gyms closed and social distancing measures were enforced.
- 29% of US exercisers purchased fitness equipment for home use post-COVID, indicating a major investment in personal home fitness spaces due to limited access to public facilities.
- In 2023, 51% of US exercisers indicated a significant preference for at-home workouts, driven by the convenience and comfort of exercising at home.
- As of 2023, there is a 10% higher frequency of the US population exercising at home several times a week compared to the gym, suggesting that regular exercisers prefer the flexibility of home workouts.
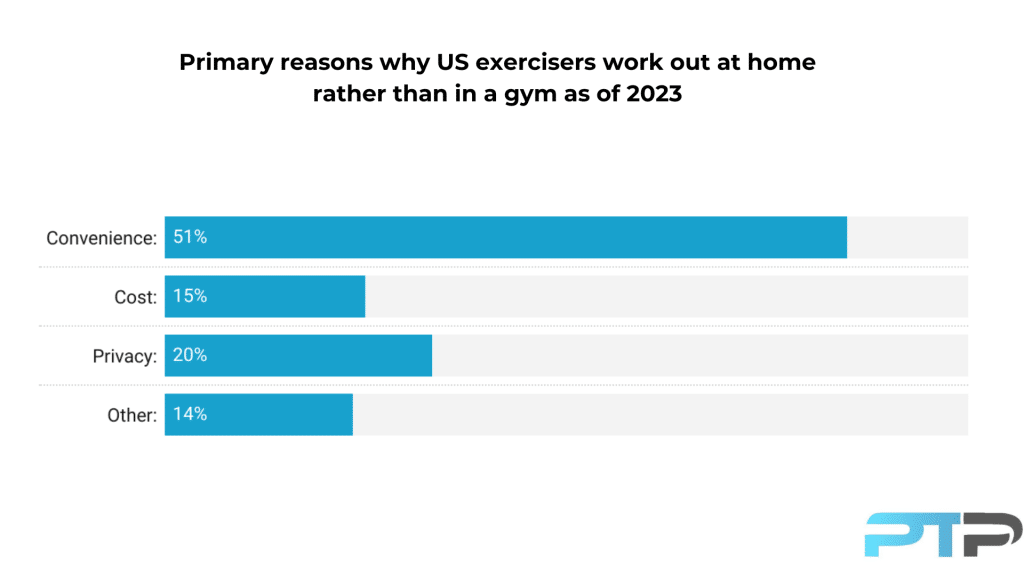
- In 2023, 51% of US exercisers cited convenience as the primary reason for preferring to exercise at home, while 20% mentioned privacy as a key factor.
- In 2020, women represented 56.7% of home fitness equipment users in the US, and individuals aged 26-35 made up the largest portion (33.8%) of the customer base.
- The largest share of home fitness equipment users in the US (38.6%) spent under $500 on a single piece of equipment, emphasizing a preference for affordability for those in North America.
Change in Fitness Routines as a Result of the Coronavirus

- In the US, 33% of the US exercisers have turned to streaming at-home fitness videos post-COVID.
This highlights the significant shift towards digital fitness solutions as gyms closed, and social distancing measures were enforced during the pandemic.
- Post-COVID, 29% of the exercisers in the US purchased fitness equipment for home use.
This indicates a major investment in creating personal home fitness spaces, driven by the need to maintain fitness routines without access to public facilities.
- In 2019, 55% of exercisers in the US worked out at a gym. This dropped by 12% in 2020 due to COVID-19, slightly decreased and partially recovered to 45% in 2022.
As a response to the challenges posed by COVID-19, the closure of gyms and the enforcement of social distancing measures in 2020 led to a temporary setback. However, the subsequent recovery in 2022 is a testament to the industry’s resilience and ability to adapt to changing circumstances in current economy.
- From 2019 to 2020, home workouts in the USA increased by 10% (from 24% to 34%). They peaked at 36% in 2021 and slightly declined to 33% in 2022.
The rise in home workouts was driven by the need for alternative exercise options during lockdowns. The slight decline in 2022 may be due to people resuming gym activities but maintaining some home workout habits.
Exclusive PTP CPT Offers |
||
|---|---|---|
Most Popular Cert | Best Online NCCA Cert | Best Study Materials |
Gold Standard Cert | A Good Option | Best CPT for you?  |
- Outdoor workouts slightly increased from 21% in 2019 to 22% in 2020, remaining stable at 22% through 2021 and 2022.
Outdoor workouts provided a safe, socially distanced way to exercise during the pandemic. Their consistent popularity suggests they remain a preferred option for many based on our market research.
Analysis of Home vs. Gym Workouts

Most Popular Locations to Workout
- In 2023, the highest percentage (51%) indicated a significant preference for at-home workouts among US exercisers.
This home workout trend could be due to the convenience, comfort, and possibly the aftermath of the COVID-19 pandemic, which saw a rise in home workout routines and online fitness programs.
- As of 2023, both the gym and outdoor workouts are equally popular, with 39% of exercisers in the US preferring each.
This suggests that traditional gym workouts are still highly favored, while outdoor activities also hold a strong appeal, possibly due to the benefits of fresh air and natural environments.
- In 2023, in the United States, workouts in fitness studios (9%) and sports leagues (8%) were less popular compared to at-home and gym workouts.
This might indicate a niche audience or a lower overall accessibility and participation rate in these more structured or organized forms of exercise.
Workout Frequency at Home Compared to the Gyms
- As of 2023, there is a significant 10% higher frequency of US exercisers working out at home several times a week compared to the gym.
This suggests that those who prefer to exercise regularly are more inclined to do so in their home gyms versus a commercial gym.
- In 2023, the percentage of the population in the US exercising several times a month is quite similar for both at home (25%) and at the gym (26%).
- In 2023, 9% more exercisers in the US workout at a gym a few times a year than those who exercise at home.
Reasons Why Exercise Workout at Home Rather Than in a Gym

- As of 2023, 51% of US exercisers indicated that convenience is the primary reason they prefer to exercise at home.
- In 2023, for 20% of US exercisers, privacy was the main reason they worked out at home.
- Only 15% of US exercisers cited cost as their main reason for working out at home in 2023.
- 14% of the exercisers in the US had various other reasons for choosing home workouts in 2023.
These reasons could include factors like personal preference, lack of time, or specific fitness goals that are better suited to home environments.
Effectiveness of Home-Based Workouts and Gym Training
- People who work out in the gym have lower body fat and visceral fat percentages compared to those who work out at home.
This could indicate that those who have a lower body fat percentage tend to be more comfortable doing their fitness activities in public when compared to exercisers with more visible body fat.
- Home-based workouts are more effective in reducing waist circumference than gym workouts.
- Gym workouts are more effective in lowering blood pressure compared to home workouts.
- Both home-based and gym workouts have similar effects on waist-to-hip ratio, heart rate, and respiratory rate.
These statistics tell us that participants can get effective workouts with either gym or home-workout approaches.
Home Fitness Equipment
Gender Distribution in Fitness Equipment Usage in the US
- In 2020, women in the USA represented 56.7% of home fitness equipment users.
Age Distribution in Fitness Equipment Usage
- In 2020, individuals aged 26-35 years in the US made up the largest portion (33.8%) of the home fitness equipment customer base.
The 26-35 age range offers the largest opportunity for competition in the home fitness equipment market.
Home Fitness Equipment Wholesale Sales
- In 2023, manufacturers’ wholesale sales of home fitness equipment in the U.S. reached slightly over 6.5 billion U.S. dollars, marking an eight percent increase compared to the previous year.
Exclusive PTP CPT Offers |
||
|---|---|---|
Most Popular Cert | Best Online NCCA Cert | Best Study Materials |
Gold Standard Cert | A Good Option | Best CPT for you?  |
- Institutional fitness equipment sales in the U.S. amounted to about 1.69 billion U.S. dollars during 2023.
These facts show the rise of at-home exercise equipment as consumer attitudes shift and more households decide to use their disposable income to buy a variety of home fitness products.
Most Popular Home Exercise Equipment
- In April 2022, a report indicated weightlifting equipment as the most popular home exercise equipment among US exercisers.
- 30.4% of the exercisers in the US claimed they owned weightlifting equipment in their homes.
This could indicate that the smaller space requirement of dumbbells and other strength training equipment appeals to exercisers. Or home gym equipment users may prefer to engage in muscle building workouts, Finally customers prefer to buy gym products that are less expensive,–because treadmills and other cardio-based machines often cost more when compared to the price of weights.
Consumer Spending Trends in the Home Exercise Equipment Market
- The largest share of home fitness equipment in the USA (38.6%) spent under $500 on a single piece of home exercise equipment.
This suggests that a significant portion of consumers prioritize affordability when making fitness-related purchases.
- A considerable proportion of home fitness equipment users in the US spent between $500 and $1,499, with 16.2% falling into the $500-$799 bracket and 15% in the $1,000-$1,499 bracket.
- While there are respondents who spent more on home exercise equipment, such as those in the $1,500-$2,999 bracket (12.3%), the percentage decreases for higher spending ranges ($3,000-$4,000 and $5,000+), indicating that fewer consumers in the US are willing to invest in higher-priced fitness equipment.
Common Reasons Why US Consumers Purchase Home Fitness Equipment
- In 2022, 27% of consumers in the US market purchase connected fitness equipment to exercise at any time.
- 11% of US consumers buy home fitness equipment to avoid gyms and studios due to health concerns.
Since the pandemic, people with previous health issues may be worried about catching diseases (like the flu or COVID-19) and prefer to work out at home. In addition, the home training equipment segment also includes people with busy schedules who need the added flexibility to perform a few exercises whenever they have a few minutes without the extra commute time required to go to the gym.
Common Reasons Exercisers Don’t Own Fitness Equipment at Home
- As of 2022, 35.6% of US exercisers mentioned that the cost was the main factor preventing them from purchasing fitness equipment for their homes.
- Approximately 20% of the home exercisers in the US indicated that the lack of space in their homes was a significant reason for not owning fitness equipment.
Both money and space are the primary restraints that prevent households from buying fitness equipment in the home fitness market. Obviously, there is a huge variety when it comes to fitness tools. Yoga mats, mobility tools like foam rollers, and resistance bands cost less and take up less space than ellipticals or exercise bikes.
Home Fitness Apps
Home Fitness Apps Market Size
- The market size for home fitness apps is expected to grow significantly from USD 2.24 billion in 2023 to an estimated USD 34.97 billion by 2030, with a compound annual growth rate (CAGR) of 11.3% over the forecast period.
The upward market growth in the home fitness app industry means that at home fitness is not just a passing phase but a part of the future development of the fitness industry.
Home Fitness Apps by Type
- The largest segment of home workout apps is “Workout & Exercise,” which makes up half of the market.
- Both “Activity Tracking” and “Lifestyle Management” home workout apps each account for 15% of the whole market.
- “Diet & Nutrition” apps represent 10% of the market.
Home Fitness Apps by Device
- Smartphones are the most common devices for home fitness apps due to their portability; tablets offer a larger screen for detailed viewing, and wearables provide real-time tracking of physical activity and health metrics.
Popular fitness channels on platforms like YouTube have experienced significant growth due to the increasing demand for home workout routines. With the advancements in technology, virtual fitness classes and personalized workout apps have also become increasingly popular among individuals looking for convenient ways to stay fit at home.
Online Fitness Services Statistics
eServices Fitness market revenue
- The online fitness market was valued at approximately $6 billion in 2020 and is projected to grow to around $59 billion by 2027.
- The market is expected to grow at a compound annual growth rate (CAGR) of around 33% from 2021 to 2027.
These figures support the growing demand for online fitness services. Efforts towards greater health awareness and innovation in the e-commerce sphere will lead to more and more revenue on the internet for businesses in the future.
Online fitness service usage

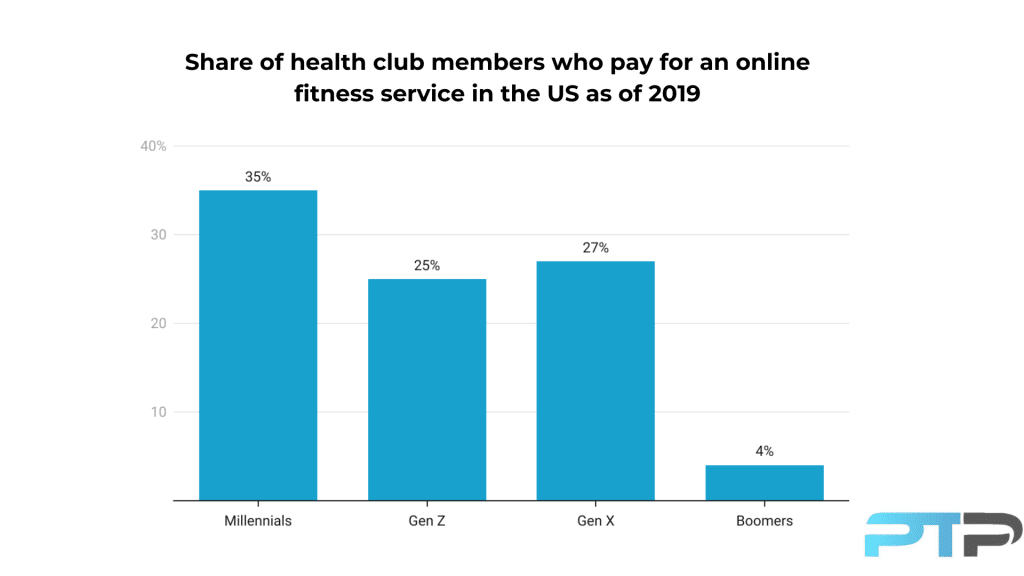
- In 2019, 35% of health and fitness club members who paid for an online fitness service in the United States were Millennials.
This high market share percentage is likely due to their familiarity with digital solutions and the convenience and flexibility offered by online fitness services.
- Gen Z accounted for 25% of health and fitness club members who paid for online fitness services in 2019 in the US.
Their substantial engagement can be attributed to their comfort with technology and online platforms as digital natives.
- In 2019, 27% of Gen X health and fitness club members paid for an online fitness service in the United States.
This significant adoption rate reflects their need for convenient and time-saving fitness options that fit into their busy lifestyles.
- Only 4% of Boomer health and fitness club members in the US paid for an online fitness service in 2019.
This low percentage is likely due to less familiarity and comfort with digital technologies compared to younger generations, as well as a preference for the traditional in-person workout experience.
- Approximately 40% of users who engaged in online fitness services during the pandemic continued to use them regularly (at least once a week) post-pandemic.
This statistic indicates the longevity of the online fitness market and its ongoing popularity and expansion.
Fitness Video Statistics
Effect of COVID-19 on Online Fitness Video Usage in the U.S. (2020):
- Home workouts have gained some popularity in the US after COVID-19, with the main content like Instagram fitness challenges, YouTube video producers posting home workouts, and personal trainers taking online classes.
- 16% of adults in the United States started using more online exercise videos due to social distancing and self-quarantining practices during the coronavirus pandemic.
Changes in Interest in Fitness Videos Over Time and Seasons
- The search interest for “home workout” videos on YouTube was relatively stable between 2016 and 2019 in the US.
- The interest in “home workouts” on YouTube saw notable spikes in early 2020, reaching its peak in April 2020.
This surge is likely due to lockdown measures, gym closures, and an increased focus on home-based fitness routines.
- After the peak in 2020, the interest in “home workouts” on YouTube in the US gradually declined but remained elevated compared to pre-pandemic levels.
This suggests a sustained higher interest in home workouts even as restrictions eased and gyms reopened.
Changes in interest in fitness videos Seasons
- Higher search interests in “home workouts” videos in the US are often observed at the beginning of each year (e.g., January 2017, January 2018, January 2019), likely due to New Year fitness resolutions.
- The interest in “home workouts” videos typically drops in the summer months (e.g., June, July, and August), possibly due to outdoor activities taking precedence over home workouts.
Regions with the Highest Interest in Fitness Videos
- States such as California, New York, and Florida showed the highest interest in fitness videos during the pandemic.
This could indicate that these three states show the highest level of interest in the health and wellness markets when compared to the rest of the country.
Fitness YouTube Channels Statistics:
Channels Performance
- Chloe Ting’s YouTube channel has the most subscribers, Blogilates has high views, and POPSUGAR Fitness has many videos, similar to Jeremy Ethier.
- Chloe Ting’s fitness channel had the highest engagement from early 2019 to mid-2020, correlating views, likes, and comments.
Video Length Analysis
- The number of shorter fitness videos under 4 minutes is higher, likely due to the trend of short-form content and YouTube Shorts.
- There are some longer fitness videos (around 50 minutes), probably streaming or long tutorials.
Publishing Schedule
- Most uploads of fitness videos are on Sundays; the highest views for videos posted on Mondays and Fridays around 11 AM-12 PM.
Popular Keywords in Titles and Comments
- Common title keywords include Workout, Fitness, Body, Cardio, Dance, Minute, Challenge; comments frequently feature positive words like Thank, Love, Great, and Good.
According to the latest marketplaces report, the home fitness industry has experienced a significant surge in demand, with a notable increase in sales of fitness equipment and online workout YouTube subscriptions. Knowing and tracking the market players is crucial in understanding the dynamics of the home fitness industry. With the rise of virtual fitness classes and more and more people accepting the process of working out at home, it is predicted that this category will continue to grow in the coming years.
Conclusion
The home fitness industry has seen significant changes, largely driven by the COVID-19 pandemic, which prompted a shift from traditional gym workouts to home-based fitness solutions. This shift has led to an increased popularity of home workouts, fitness equipment purchases, and the use of digital fitness platforms. For stakeholders in the fitness industry, from equipment manufacturers to digital service providers, understanding these trends is essential.
Furthermore, with the rise of smart home technology and the convenience it offers, more people are opting for home-based fitness solutions. This trend is expected to drive further growth in the home fitness industry in the coming years.
The data suggests that a considerable number of exercisers will continue to favor home fitness, valuing the convenience and privacy it offers. Additionally, the rapid growth of home fitness apps and online fitness services highlights the industry’s ongoing digital transformation. These home gym statistics and trends for 2024 demonstrate that the appeal of home fitness remains strong due to its convenience, affordability, and flexibility. By aligning with these trends and market insights, industry players can better meet the changing needs and preferences of fitness enthusiasts, ensuring continued engagement and growth in this vibrant market.
References
- Gough, Christina. “Covid-19: Impact on the US Home Fitness Routines 2020.” Statista, 16 Aug. 2022, www.statista.com/statistics/1327102/fitness-routine-covid-impact/.
- “Moving Past the Pandemic: How Fitness Habits Have Changed.” Health & Fitness Association, www.healthandfitness.org/improve-your-club/moving-past-the-pandemic-how-fitness-habits-have-changed/.
- Gough, Christina. “Most Popular Workout Locations US 2023.” Statista, 22 Jan. 2024, www.statista.com/statistics/1445801/most-popular-workout-locations/.
- Goodwin, Emily. “More Americans Work out at Home than in Gyms, Citing Convenience.” CivicScience, 20 Oct. 2023, civicscience.com/more-americans-work-out-at-home-than-in-gyms-citing-convenience/
- Habib, Nashmia, et al. “Comparison of the Effectiveness of Home-Based Workouts and Gym Training According to Caloric Intake.” ResearchGate, www.researchgate.net/publication/366893292_Comparison_of_the_Effectiveness_of_Home-Based_Workouts_and_Gym_Training_according_to_Caloric_Intake.
- Tighe, D. “U.S. Consumer Fitness Equipment Wholesale Sales from 2007 to 2023.” Statista, 10 May 2024, www.statista.com/statistics/236127/us-fitness-equipment-sales-for-home-use/.
- Gough, Christina. “Most Popular Home Exercise Equipment among Users in the United States as of April 2022.” Statista, 12 Oct. 2023, www.statista.com/statistics/1337460/most-common-home-exercise-equipment/.
- Tighe, D. “Highest Spend on a Single Piece of Home Exercise Equipment by Consumers in the United States as of April 2022.” Statista, 11 June 2024, www.statista.com/statistics/1338356/highest-spend-exercise-equipment-united-states/.
- Laricchia, Federica. “Main Reasons Why Consumers Purchase Connected Fitness Equipment in the United States in 2022.” Statista, 15 Dec. 2023, www.statista.com/statistics/1350671/reasons-for-buying-connected-fitness-equipment-us/.
- Gough, Christina. “Most Common Reasons for Not Owning Fitness Equipment at Home in the United States as of April 2022.” Statista, 12 Oct. 2023, www.statista.com/statistics/1337647/reasons-not-owning-fitness-equipment-at-home-united-states/.
- “Home Fitness App Market by Type (Diet & Nutrition, Activity Tracking, Workout & Exercise, Lifestyle Management, Others (Meditation & Yoga, Etc.) Platform (Android, iOS) Device (Smartphone, Tablet, Wearable) and Region, Global Trends and Forecast from 2023 to 2030.” Exactitude Consultancy, 23 Feb. 2024, exactitudeconsultancy.com/reports/34432/home-fitness-app-market/.
- Published by Statista Research Department. “Online Revenue Forecast for the eServices Fitness Market in United States from 2017 to 2024.” Statista, 14 Dec. 2023, www.statista.com/forecasts/891113/eservices-fitness-revenue-by-segment-in-united-states.
- Gough, Christina. “Share of Health and Fitness Club Members Who Pay for an Online Fitness Service in the United States in 2019, by Age.” Statista, 27 Oct. 2022, www.statista.com/statistics/1244829/online-fitness-service-usage/.
- Google Trends, trends.google.com/trends/explore?geo=US&gprop=youtube.
- Vu, Chloe. “Exploring Video Performance of Popular Fitness Channels.” Medium, Medium, 13 Feb. 2024, medium.com/@vpanh/exploring-video-performance-of-popular-fitness-channels-e0a6bce74f94.

 Have a question?
Tyler Read
PTPioneer Editorial Integrity
All content published on PTPioneer is checked and reviewed extensively by our staff of experienced personal trainers, nutrition coaches, and other Fitness Experts. This is to make sure that the content you are reading is fact-checked for accuracy, contains up-to-date information, and is relevant. We only add trustworthy citations that you can find at the bottom of each article. You can read more about our editorial integrity here.