The fitness industry has undergone significant changes in recent years, influenced by technological advancements, changing consumer behaviors, and global events like the COVID-19 pandemic. In this market research breakdown, PTPioneer, we will look deeper at how the fitness world is growing, what new trends are emerging, and the big changes happening in 2024 and beyond to better understand the current state and future of the industry.
Overview of Key Fitness Industry Statistics
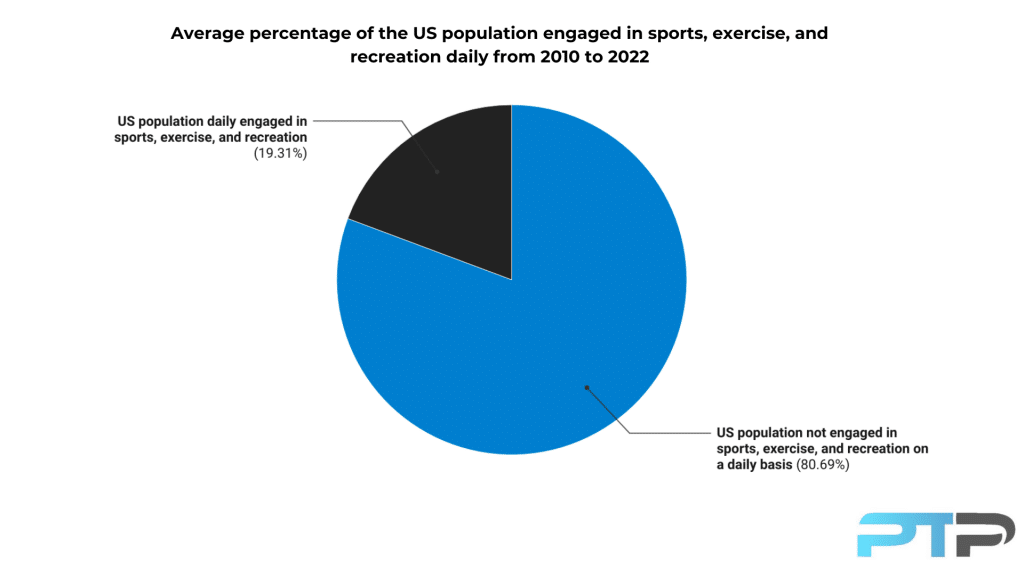
- On average, 19.31% of the US population is daily engaged in sports, exercise, and recreation from 2010 to 2022.
- Surprisingly, 3.4% more people started exercising daily after the COVID-19.
- 21.29% of men and 17.07% of women were daily engaged in physical activities from 2010 to 2022, though post-COVID, men’s engagement almost returned to 2010 rates while women’s engagement increased by 3.5%.
- In 2023, hiking emerged as the most popular sports activity in the US, while rugby was the least preferred.
- 70% of millennials participated in fitness activities in 2021, followed by Baby Boomers and Gen X, with similar rates of around 64%.
- In 2020, health and gym club revenue dropped 33.04%, while sporting goods sales increased by 38.93% during the same period.
- With a $156 billion market capitalization in 2023, Nike is the leading sportswear company in the US, followed by Dick’s Sporting Goods with a $9.5 billion market capitalization.
- 59% of Americans preferred working out at home in 2020, with 51% citing convenience as the main reason.
- In 2022, home gym product sales increased to an estimated $424 million, almost doubling the sales of 2019.
What Percent of the Population Engages in Daily Physical Activities
In order to understand the current state of the fitness market, let’s look at data from population participation in sports in the United States over the last decade.
How Many People Are Doing Physical Activities Daily in the USA?
- Only 19.31% of the US population is engaged in sports, exercise, and recreation daily from 2010 to 2022.
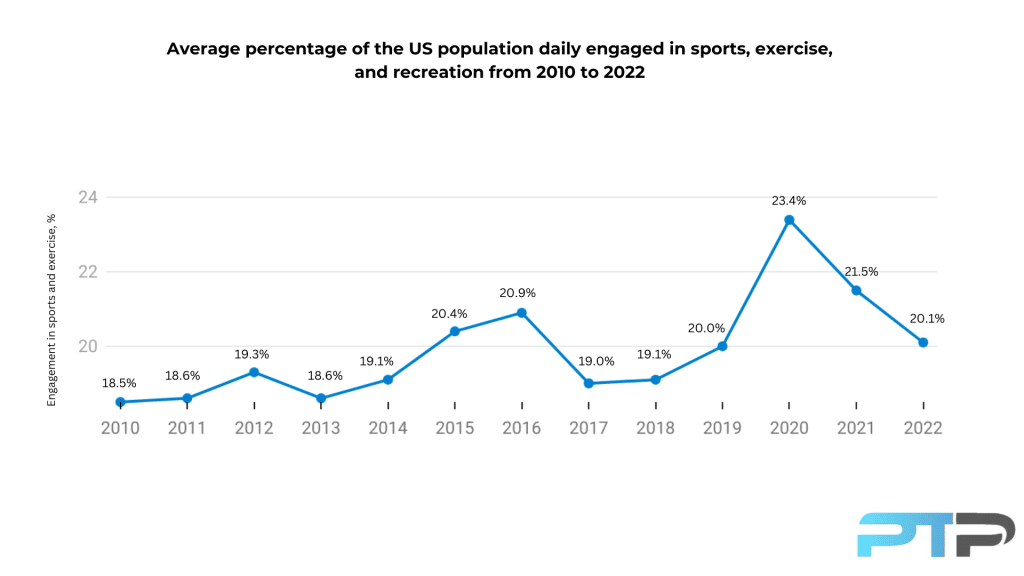
- Between 2010 and 2022, more people in the US are getting daily activity. The engagement rate in physical activities has gone up by 1.6%.
- 2020 stands out as a year of significant growth, marked by a 3.4% increase in the percentage of the US population engaged in sports, exercise, and recreation.
With lockdowns and restrictions in place due to the COVID-19 pandemic, people turned to outdoor activities, home workouts, and recreational activities to stay active and maintain mental well-being.
- In the post-pandemic period, the US population’s engagement rate in sports, exercise, and recreation stabilized and returned to pre-pandemic norms.
Gender Differences in Physical Activity Participation in the US Population
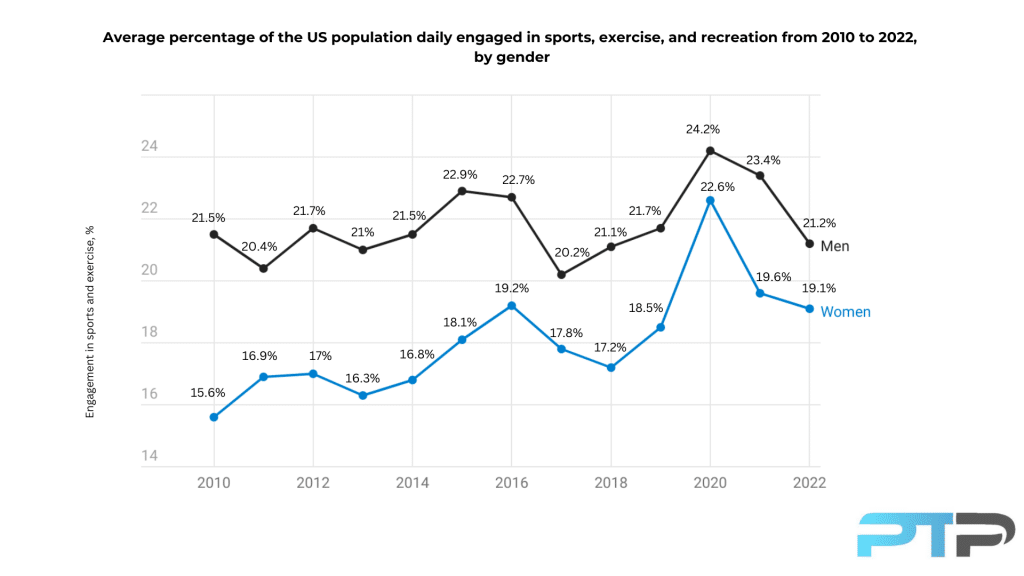
- 21.29% of men engaged in sports, exercise, and physical recreation in the US between 2010 and 2022, while women’s participation rate was only 17.07%.
Reasons for this may include a history of segregation, societal norms, and stereotypes that discouraged women from participating in sports. There have been fewer women in leadership roles in the sports industry. Recently, more funding may have increased women’s participation. However, this rate is still not equal in comparison between genders.
- In 2020, 2.5% more men and 4.1% more women were engaged in sports, exercise, and recreation daily in the US compared to the previous year.
This suggests a notable surge in engagement, possibly influenced by factors such as increased health and fitness awareness, lifestyle changes due to the COVID-19 pandemic, or other socio-economic factors.
- Post-COVID, men’s daily engagement in physical activities almost equaled 2010 rates, decreasing by 0.4%, while women’s engagement increased by 3.5%.
Women might have been more receptive to health and fitness trends during this period, leading to an increase in their participation in sports and exercise. Plus, efforts to promote women’s sports and highlight female athletes could have encouraged more women to engage in sports and exercise.
Fitness Sports Participation Trends Across Age Groups in the United States
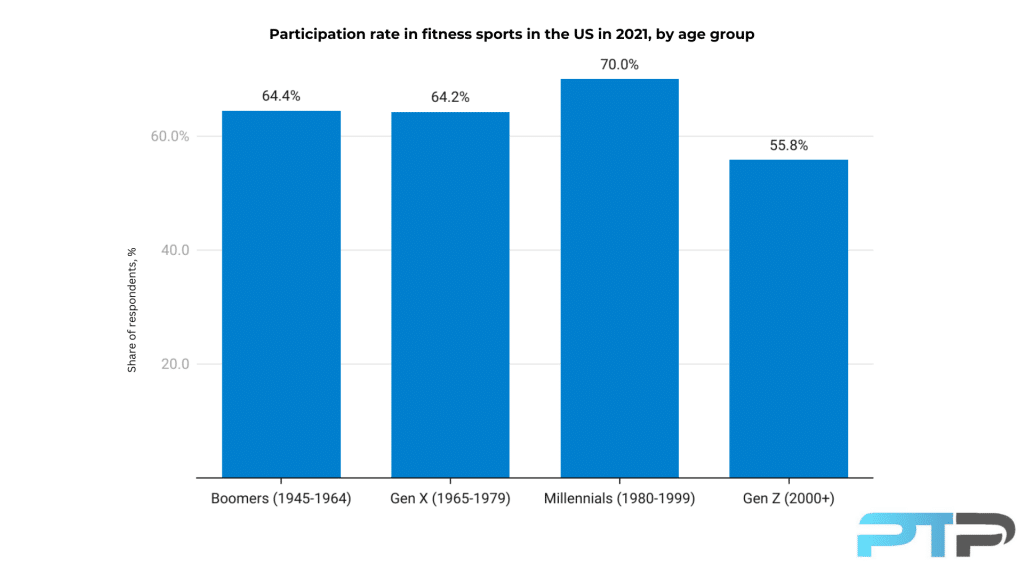
- In 2021, 70% of millennials in the US participated in fitness activities, marking the highest participation rate among all demographics.
This could be attributed to various factors such as increased awareness of health and fitness trends, access to fitness-related technology and resources, and changing societal norms regarding physical activity.
- Baby Boomers and Gen X had relatively similar participation rates in fitness sports in the US in 2021, with Boomers at 64.4% and Gen X at 64.2%.
- Only 55.8% of Gen Z participated in fitness sports activities in the US in 2021, marking the lowest level of engagement compared to other demographics.
Exclusive PTP CPT Offers |
||
|---|---|---|
Most Popular Cert | Best Online NCCA Cert | Best Study Materials |
Gold Standard Cert | A Good Option | Best CPT for you?  |
Gym Membership Statistics
Looking at the gym industry can help us understand both fitness industry trends, and the current state of the wellness industry. Typically, when gym memberships increase, it means that the market is trending towards the health and fitness sphere. This also correlates with people hiring personal trainers with the best fitness certifications, further boosting overall health and fitness.
How many people attend health clubs in the USA?
- Over 66.5 million Americans, with a notable increase of 3.8% in participation rate compared to previous years, started attending a health club or studio in 2021.
Gender Distribution Among Health Club Members in the US
- 58.2% of men and 41.8% of women in the US were engaged in gym or health club activities in 2020.
- From 2010 to 2019, the number of female health club members in the US increased by 32.2%, compared to a 23.2% increase among male health club members.
- On average, male US health club members maintain subscriptions for 5 years, while females typically stay subscribed for 4.4 years.
- In the US, both genders visit health and fitness centers regularly, with males averaging 106 visits/year and females averaging 102 visits/year.
- Male health and fitness club members in the US tend to favor multipurpose clubs and sports-specific studios, while females are more likely to join yoga, pilates, or barre studios.
- Male health and fitness club members in the United States typically prefer strength equipment, while females prefer cardio equipment.
Health and Fitness Club Membership Statistics Across Age Groups in the US
- Only 16.1% of gym members in the US were in the 6-17 age group in 2020.
- Gym members in the US in the 6-17 age group showed the highest growth rate of 69.81% from 2010 to 2019.
It suggests a growing awareness among young individuals and perhaps an increased emphasis on physical fitness from parents or schools.
- In 2019, the largest segment of health club members in the US was young adults (18-34), with 19.83 million members, about 31.41% of the total membership.
This trend is likely influenced by factors such as a focus on appearance, health consciousness, and social dynamics.
- 23.8% more Americans in the 18-34 age group started attending gym clubs from 2010 to 2019.
- In 2020, 18-34-year-olds made up the largest portion of health and fitness club members, comprising 60.60% of total memberships.
- In 2019, 19.72 million gym club members, or about 31.24% of total memberships, were in the 35-54 age group, ranking as the second largest segment in the US.
- 11.55% of growth was noticed in the number of gym club members in the 35-54 age group from 2010 to 2019.
- In 2020, the percentage of health and fitness club members in the 35 to 54 age group decreased slightly to 30.70%.
- In 2019, the number of health and fitness club members aged 55+ represented approximately 22.69% of gym membership, with 14.32 million members
- In 2020, the percentage of health and fitness club members in the 55+ age group stayed relatively stable, making up 22.3% of total memberships.
The Most Popular Fitness and Sports Activities in the US
- As of 2023, hiking is the most popular sports activity in the US.
- Rugby is the least preferred sports activity in the US in 2023.
- In 2021, US running or jogging participation dropped to 49 million, marking the lowest figure since 2016 and indicating a declining trend compared to previous years.
The COVID-19 pandemic, which began in early 2020, may have played a role. Restrictions on outdoor activities, gym closures, and concerns about public health could have deterred people from engaging in outdoor exercises like running. Also, newer research on weight loss may have led many people to increase walking as a joint-friendly alternative to running.
- In 2022, the number of people who ride bikes increased from 51.4 million in 2021 to 54.7 million, representing a difference of 3.3 million individuals in the US.
Several factors, such as lifestyle changes due to the COVID-19 pandemic, the promotion of biking infrastructure by local governments, and initiatives to reduce carbon emissions, could have contributed to the rise in bike ridership.
- The US population’s participation in swimming decreased from over 31 million in 2019 to about 28.4 million in 2021.
Several factors could have contributed to the decline in swimming participation between 2019 and 2021. These may include changes in lifestyle patterns, accessibility to swimming facilities (especially during the COVID-19 pandemic), shifting interests among the population, or other external factors.
Exclusive PTP CPT Offers |
||
|---|---|---|
Most Popular Cert | Best Online NCCA Cert | Best Study Materials |
Gold Standard Cert | A Good Option | Best CPT for you?  |
- A 63.8% increase was noticed in the number of yoga participants in the US, reaching approximately 34.4 million participants from 2010 to 2021.
Factors including increased awareness, accessibility, diverse offerings, celebrity endorsement, and cultural acceptance have contributed to the significant growth in the number of yoga participants in the US.
- 2020 and 2021 marked a significant increase in skateboarding participation in the United States, with an estimated nearly 8.8 million participants.
The COVID-19 pandemic played a role. With restrictions on indoor activities and a desire for outdoor recreation, more people may have turned to activities like skateboarding during this time.
Other reasons for the increase in recent years might include cultural trends, marketing efforts by skateboarding companies, increased media coverage or the influence of social media in promoting the sport.
Gym Club Market Size in the US
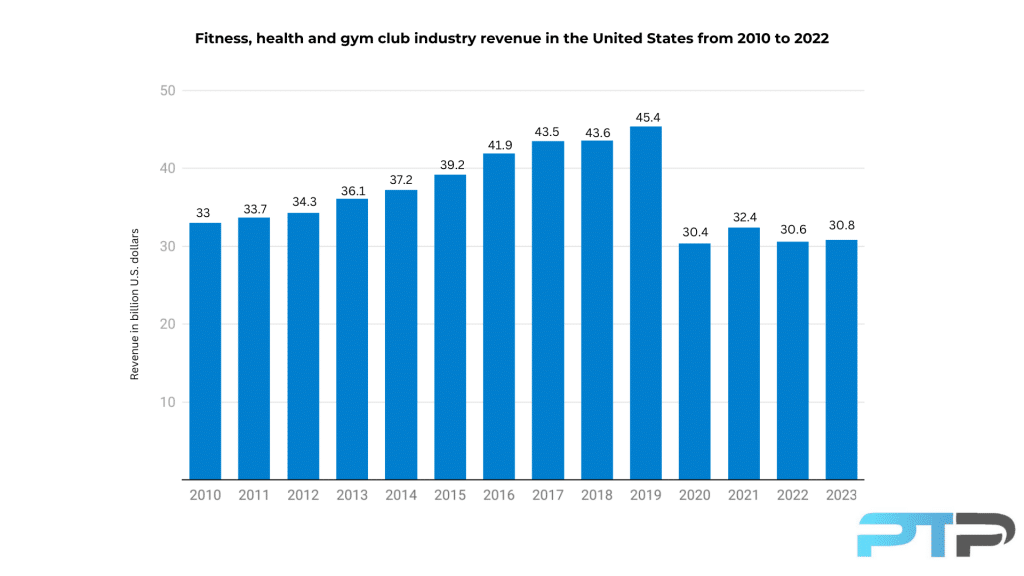
- The revenue of the gym club industry in the United States steadily grew by 3.52% until the end of 2019.
- In 2020, there was a significant drop of 33.04% in the revenue of the gym club from $45.4 billion to $30.4 billion.
This decline can be related to the COVID-19 pandemic, which resulted in the closure of many fitness facilities and a decrease in consumer spending on fitness-related services.
- After 2020, the US gym club revenue remained relatively stable, with a growth rate of approximately 0.32%.
This indicates that the industry is stabilizing post-pandemic but may still face challenges in fully recovering to pre-pandemic levels.
Number of Gym Clubs in the US
When more fitness studios pop up in the same area, this leads to greater competition for real estate and consumers. However, with more and more people exercising from home, the scramble for clients has moved online.
- There was a steady rise in the number of gym clubs, peaking at 41,370 in 2019 with a 3.88% annual growth.
- In 2020, there was a notable drop of 16.99% in the number of clubs in the US.
This was possibly due to various factors, such as economic challenges and changes in consumer behavior, related to the impact of the COVID-19 pandemic. Many businesses, including gyms and fitness centers, faced closures or restrictions due to safety concerns and government regulations.
- There is a downward trend in the number of gym clubs in the US that continues until 2021, with a further decrease of 6.02% compared to 2020.
- In 2022, the number of gym clubs in the US decreased by approximately 3.84%, but the rate of decline appears to slow down compared to the previous two years.
This could indicate some stabilization in the industry as it adjusts to the ongoing challenges posed by the pandemic.
Sporting Goods Market Size in the US
The fitness equipment market brings in millions and millions of dollars every year.
Sporting Goods Store Sales in the United States
- From 2003 to 2022, sales of sporting goods through mail-order and e-commerce in the US grew from $3 million to $39 million.
- Before COVID-19, sporting goods sales in the US grew steadily at around 25.08%, indicating a healthy and sustained expansion in the market.
This period of growth was likely influenced by factors such as increasing consumer interest in sports and fitness, advancements in e-commerce technology, and changing consumer preferences toward online shopping.
- Between 2019 and 2021, US sporting goods sales surged from $22.6M to $40.5M, marking a robust 38.93% growth.
This growth in sales of sports products is related to the COVID-19 pandemic. Due to lockdowns and restrictions, people spent more time at home, which heightened their health and fitness awareness. Many individuals turned to home workouts and outdoor activities, driving demand for sports products.
Despite disruptions to sports events and activities, the industry adapted by offering virtual experiences, online classes, and innovative products tailored for home use, sustaining consumer interest and sales.
Sporting Goods Wholesale Sales in the United States
- From 2010 to 2019, US wholesale sales of sports products were consistently rising, with a 3.13% annual growth rate.
- There was a remarkable increase in the US wholesale sales of sports products in 2021, rising to $111.71 billion, reflecting a growth rate of 15.77%.
Wholesale sales growth was driven by the reopening of the economy and the rebound in demand. As consumer demand for sports products rebounded, wholesalers invested more in the production of sports products to meet the increasing number of orders from stores and online shops.
What are the Leading Sportswear Companies in the US
- As of 2023, Nike held the top position as the largest sportswear company based in the United States, with a $156 billion market capitalization.
- Dick’s Sporting Goods ranked as the second largest sportswear company based in the United States in 1023, with a market capitalization of approximately $9.5 billion.
Home Workout Trends and Preferences Among American Exercisers?
- 59% of Americans preferred working out at home in 2020.
- As of 2023, 52% of Americans exercise regularly at home and 28% at gyms.
- In 2023, at-home exercisers in the US are 21% more likely to work out once a week or more compared to gym-goers.
- For 51% of US exercisers, convenience is the main reason for working out at home.
- 20% of US exercisers claimed privacy as the primary reason they work out from home.
- Only 15% of US exercisers say that the cost is why they work out at home.
Trends and Market Insights of Home Gym Equipment Sales in the US
- In 2022, the wholesale sales of home gym products reached an estimated 424 million U.S. dollars. It was nearly 50% more than the home gym product sales in 2019.
Several factors could contribute to the increasing sales of home gym products. These might include a growing awareness of health and fitness, lifestyle changes due to the COVID-19 pandemic, preference for convenience and privacy in exercising, advancements in home gym technology, and the rise of remote work, allowing individuals more time flexibility to invest in home fitness solutions.
- As of 2022, weightlifting equipment was the most common home exercise equipment in the United States, with 30.4% of survey respondents claiming to own it in their homes.
- 40% of US home exercisers own or have access to home gym equipment.
- 51% of US home exercisers don’t own or don’t plan to purchase home gym equipment.
- 9 % of US home exercisers aren’t owners but plan to buy home gym equipment.
- The market for home gym equipment hasn’t changed since the early days of the pandemic in the US.
- As of 2022, 35.6% of individuals in the US working out at home cited price as the main reason for not owning fitness equipment.
- As of 2022, approximately one-fifth of US home exercisers identified the lack of space as a barrier to owning home fitness equipment.
Fitness Apps
One of the newer areas in the fitness market is the growth of fitness apps. This rise is bolstered by the rise in wearables that track fitness metrics which can be analyzed through various apps. More users means more money and a larger part of the market.
- From 2017 to 2021, the US fitness apps market experienced significant growth by 14.6%, reaching a valuation of US $1.1 Billion in 2021.
- In 2022, workout and fitness apps dominated the US health and fitness app market, comprising 23.6% of downloads.
- In 2022, weight loss apps trailed with a 14% market share, while women’s health apps accounted for approximately 4% of downloads in the United States.
- In 2022, Planet Fitness was the top health and fitness app in the US, with over 18 million downloads.
- In 2022, Sweatcoin, focusing on sport and activity tracking, was the second most downloaded app in the US, with around 9 million downloads.
- In 2022, Calm, a mental wellness and meditation app, ranked third with 8.8 million downloads in the US.
Conclusion
According to recent statistics, the fitness industry has been experiencing significant growth in recent years. The number of downloads for health and fitness apps in the United States alone reached over 1.2 billion in 2022, indicating a strong consumer interest in digital fitness platforms.
Additionally, gym memberships have seen a steady increase over the past decade, with an estimated 71.5 million Americans belonging to a fitness club in 2020. This number is expected to rise even further in the coming years as more people prioritize their health and well-being.
Additionally, the COVID-19 pandemic has led to a surge in home fitness equipment sales, indicating a shift towards at-home workouts and virtual fitness classes. This trend is further supported by the rise in popularity of fitness apps and online fitness platforms, offering convenient and accessible options for people to stay active from the comfort of their own homes.
Through analyzing these markets, we can understand where the field of health and wellness is and where it will be in the coming years, including where profitable jobs and industries will be. This information can give burgeoning trainers and businesses an overview of the state of the industry, and serve as a road map of where a business should place their efforts, including performance benchmarks to set for themselves.
References
- Gough, C. (2023, August 28). Americans engaged in sports and exercise per day US 2022. Statista. https://www.statista.com/statistics/189562/daily-engagement-of-the-us-poppulation-in-sports-and-exercise/
- Statista Research Department. (2022, December 9). U.S. participation in fitness sports by generation 2021. Statista. https://www.statista.com/statistics/1051774/us-participation-in-fitness-sports-by-generation/
- IHRSA Staff. (2022, June 20). U.S. health club membership reaches over 66 million Americans. IHRSA. https://www.ihrsa.org/about/media-center/press-releases/u-s-health-club-membership-reaches-over-66-million-americans
- Lindner, J. (2023, December 26). Must-know gym gender statistics [recent analysis] • gitnux. GITNUX. https://gitnux.org/gym-gender-statistics/
- Gough, C. (2022, October 27). Gym membership length in the U.S. by gender 2019. Statista. https://www.statista.com/statistics/1244788/gym-membership-length/
- 2021 IHRSA media report. 2021 IHRSA Media Report. (n.d.). https://hub.ihrsa.org/2021-ihrsa-media-report
- The 2020 IHRSA global report. IHRSA. (n.d.). https://www.ihrsa.org/publications/the-2020-ihrsa-global-report/
- Gough, C. (2022, October 27). Gym membership growth in the U.S. by age 2019. Statista. https://www.statista.com/statistics/246984/obstacles-to-joining-a-health-club/
- Gough, C. (2022, October 27). Gym membership in the U.S. by age 2019. Statista. https://www.statista.com/statistics/1244806/gym-members-age/
- Gym, Health & Fitness Clubs in the US – Market Size (2004–2029). IBISWorld Industry Reports. (2023, November 27). https://www.ibisworld.com/industry-statistics/market-size/gym-health-fitness-clubs-united-states/
- Bashir, U. (2024, February 13). Most popular sports activities in the U.S. as of December 2023. Statista. https://www.statista.com/forecasts/1388964/most-popular-sports-activities-in-the-us
- Statista Research Department. (2024, April 12). Number of running and jogging participants in the United States from 2010 to 2023. Statista. https://www.statista.com/statistics/190303/running-participants-in-the-us-since-2006/
- Statista Research Department. (2023, October 11). Bicycling participation in the U.S. 2010-2022. Statista. https://www.statista.com/statistics/191204/participants-in-bicycling-in-the-us-since-2006/
- Statista Research Department. (2024, March 26). Swimming participation in the U.S. 2011-2023. Statista. https://www.statista.com/statistics/191621/participants-in-swimming-in-the-us-since-2006/
- Statista Research Department. (2024, March 26). Yoga participation in the U.S. 2010-2023. Statista. https://www.statista.com/statistics/191625/participants-in-yoga-in-the-us-since-2008/
- Statista Research Department. (2024a, March 26). Skateboarding participation in the U.S. 2010-2023. Statista. https://www.statista.com/statistics/191308/participants-in-skateboarding-in-the-us-since-2006/
- Gough, C. (2023, December 12). Gym, health & fitness club industry revenue in the United States 2010-2023. Statista. https://www.statista.com/statistics/605223/us-fitness-health-club-market-size-2007-2021/
- Gough, C. (2022, October 27). Number of U.S. health clubs & fitness centers 2008-2022. Statista. https://www.statista.com/statistics/244922/us-fitness-centers-und-health-clubs/
- Statista Research Department. (2024, February 23). Mail-order and e-commerce sales of sporting goods in the U.S. 2003-2022. Statista. https://www.statista.com/statistics/185459/us-online-shops-and-mail-order-houses-sales-figures-for-sporting-goods/
- Tighe, D. (2023, May 16). Wholesale sales of the U.S. sporting goods industry in the U.S. 2008-2022. Statista. https://www.statista.com/statistics/240946/sports-products-industry-wholesale-sales-in-the-us/
- Smith, P. (2023, October 18). Leading US based sportswear companies by market cap October 2023. Statista. https://www.statista.com/statistics/1262796/top-us-sports-companies-by-market-cap/
- Goodwin, E. (2023, October 20). More Americans Work Out at Home Than in Gyms, Citing Convenience. CivicScience. https://civicscience.com/more-americans-work-out-at-home-than-in-gyms-citing-convenience/
- Tighe, D. (2023, June 16). Wholesale sales (consumer segment) of home gyms in the U.S. 2007-2022. Statista. https://www.statista.com/statistics/236139/us-wholesale-sales-of-home-gyms-consumer-segment/
- Gough, C. (2023, October 12). Most common home fitness equipment in the U.S. as of April 2022. Statista. https://www.statista.com/statistics/1337460/most-common-home-exercise-equipment/
- Gough, C. (2023c, October 12). Most common reasons for not owning fitness gear at home in the U.S. as of April 2022. Statista. https://www.statista.com/statistics/1337647/reasons-not-owning-fitness-equipment-at-home-united-states/
- Fitness apps market. Fitness Apps Market Snapshot (2022 to 2032). (2022, May 2). https://www.futuremarketinsights.com/reports/fitness-apps-market
- Laura Ceci. (2023, December 4). U.S. health and fitness apps download share by subcategory 2022. Statista. https://www.statista.com/statistics/1348730/app-us-health-and-fitness-download-share-by-subcategory/
- Laura Ceci. (2024, February 5). Most downloaded health and fitness apps U.S. 2022. Statista. https://www.statista.com/statistics/1284844/us-top-health-and-fitness-apps-by-downloads/
FAQ’s About Fitness Industry
How has the fitness industry grown over the past decade?
Over the past decade, the fitness industry has experienced significant growth, evidenced by an increase in market value, revenue, and the number of fitness-related businesses and gym memberships. Additionally, there has been a notable rise in online fitness services.
What are the projected growth rates for the fitness industry in the next five years?
The projected growth rates for the fitness industry in the next five years vary by source, but many estimates suggest a compound annual growth rate (CAGR) of around 7-10%. This growth is driven by increasing health awareness, the rise of digital fitness solutions, and a growing emphasis on wellness and preventive healthcare.
How has the COVID-19 pandemic impacted the fitness industry?
The COVID-19 pandemic has dramatically impacted the fitness industry, leading to a significant increase in the use of virtual workout platforms and a shift of many personal trainers to online services. Additionally, fitness clubs have experienced major revenue losses due to lockdowns and social distancing measures.
How many fitness clubs or gyms are there in the United States?
As of 2024, there are 114,370 fitness clubs or gyms in the United States, according to IBISWorld’s statistics.

 Have a question?
Tyler Read
PTPioneer Editorial Integrity
All content published on PTPioneer is checked and reviewed extensively by our staff of experienced personal trainers, nutrition coaches, and other Fitness Experts. This is to make sure that the content you are reading is fact-checked for accuracy, contains up-to-date information, and is relevant. We only add trustworthy citations that you can find at the bottom of each article. You can read more about our editorial integrity here.